kalman
- class nfoursid.kalman.Kalman(state_space: nfoursid.state_space.StateSpace, noise_covariance: numpy.ndarray)
Bases:
objectImplementation [1] of a Kalman filter for a state-space model
state_space: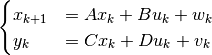
The matrices
 are taken from the state-space model
 state_space. The measurement-noise and process-noise
  have a covariance matrix
noise_covariancedefined as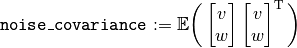
[1] Verhaegen, Michel, and Vincent Verdult. Filtering and system identification: a least squares approach. Cambridge university press, 2007.
- actual_label = 'actual'
Label given to a column in
self.to_dataframe, indicating measured values.
- extrapolate(timesteps) pandas.core.frame.DataFrame
Make a
timestepsnumber of steps ahead prediction about the output of the state-space modelself.state_spacegiven no further inputs. The result is apd.DataFramewhere the columns areself.state_space.y_column_names: the output columns of the state-space modelself.state_space.
- filtered_label = 'filtered'
Label given to a column in
self.to_dataframe, indicating the filtered state of the Kalman filter.
- next_predicted_corrected_label = 'next predicted (input corrected)'
Label given to a column in
self.to_dataframe, indicating the predicted state of the Kalman filter corrected by previous inputs. The inputs to the state-space model are known, but not at the time that the prediction was made. In order to make a fair comparison for prediction performance, the direct effect of the input on the output by the matrix is removed in this column.
The latest prediction will have
np.nanin this column, since the input is not yet known.
- next_predicted_label = 'next predicted (no input)'
Label given to a column in
self.to_dataframe, indicating the predicted state of the Kalman filter under the absence of further inputs.
- output_label = 'output'
Label given to an output column in
self.to_dataframe.
- plot_filtered(fig: matplotlib.figure.Figure)
The top graph plots the filtered output states of the Kalman filter and compares with the measured values. The error bars correspond to the expected standard deviations. The bottom graph zooms in on the errors between the filtered states and the measured values, compared with the expected standard deviations.
- plot_predicted(fig: matplotlib.figure.Figure, steps_to_extrapolate: int = 1)
The top graph plots the predicted output states of the Kalman filter and compares with the measured values. The error bars correspond to the expected standard deviations.
The stars on the top right represent the
steps_to_extrapolate-steps ahead extrapolation under no further inputs. The bottom graph zooms in on the errors between the predicted states and the measured values, compared with the expected standard deviations.
- standard_deviation_label = 'standard deviation'
Label given to a standard deviation column in
self.to_dataframe.
- step(y: Optional[numpy.ndarray], u: numpy.ndarray)
Given an observed input
uand outputy, update the filtered and predicted states of the Kalman filter. Follows the implementation of the conventional Kalman filter in [1] on page 140.The output
ycan be missing by settingy=None. In that case, the Kalman filter will obtain the next internal state by stepping the state space model.[1] Verhaegen, Michel, and Vincent Verdult. Filtering and system identification: a least squares approach. Cambridge university press, 2007.
- to_dataframe() pandas.core.frame.DataFrame
Returns the output of the Kalman filter as a
pd.DataFrame. The returned value contains information about filtered and predicted states of the Kalman filter at different timesteps. The expected standard deviation of the output is given, assuming independence (!) of the state estimation error and measurement noise.The rows of the returned dataframe correspond to timesteps. The columns of the returned dataframe are a 3-dimensional multi-index with the following levels:
The output name, in the list
self.state_space.y_column_names.- An indication of whether the value is
a value that was actually measured, these values were given to self.step as the y parameter,
a filtered state,
a predicted state given no further input or
a predicted state where the effect of the next input has been corrected for. This column is useful for comparing prediction performance.
Whether the column is a value or the corresponding expected standard deviation.